
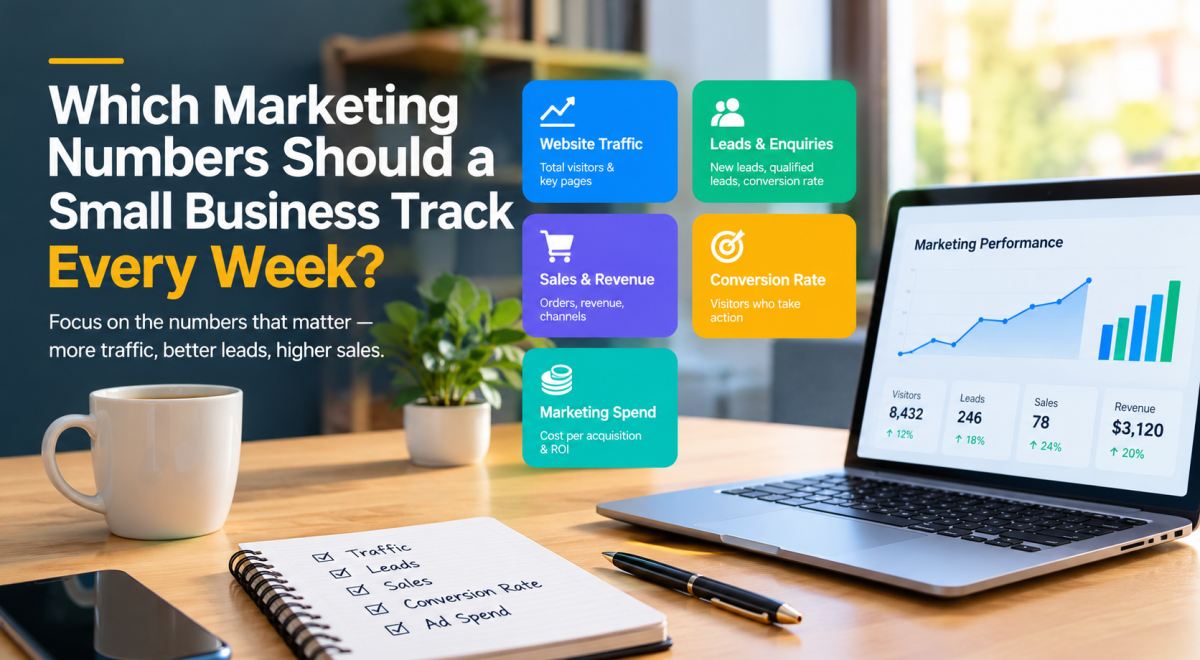
Which marketing numbers should a small business track every week?
If you run a small business, marketing is one job among many. You’re also handling sales, customer questions, invoices, and whatever broke today. Opening every analytics report on top of that turns into yet another job.
So track less. A handful of numbers can tell you whether your marketing is bringing in the right people, producing leads, and making sales.
Which numbers matter depends on what you sell. A plumber cares about enquiries and booked appointments. An online shop cares about orders, conversion rate, and ad costs. A content site watches organic search clicks, email subscribers, and affiliate link clicks.
For most small businesses, a good weekly check covers traffic, leads, sales, conversion rate, and what you spent. The point isn’t to collect data. It’s to see what’s working and decide what to do next.
1. Website traffic and where it comes from
Traffic tells you whether people are finding your site and which channels send them. It doesn’t tell you whether your marketing works. A thousand visitors who don’t care about your products are worth less than 100 who came looking for exactly what you sell.
Each week, note:
- Total sessions
- Sessions from organic search, social media, email, referrals, and paid ads
- Visits to your key product, service, or landing pages
- How all of that compares with last week
Google Analytics shows how people arrive and what they do afterward. Google Search Console covers the Google Search side: clicks, impressions, click-through rate, and average position.
Say Pinterest sends you more visits this week and Google sends fewer. That doesn’t mean your SEO is failing. One popular pin can cause a short spike in social traffic. Look at which pages got the extra visits and whether those visitors did anything useful.
If impressions in Search Console are climbing but clicks aren’t, your pages are showing up for more searches without winning the click. Check the queries and rewrite the titles and descriptions of the pages involved.
You don’t need to compare every channel weekly. Pick your top three sources and watch those.
2. Leads and enquiries
A lead is someone who has shown interest and could become a customer: a contact form submission, a phone call, a quote request, a consultation booking. If you sell services, leads often tell you more than traffic does.
Track the number of new leads, where they came from, how many were qualified, and how many moved on to a conversation or appointment.
A qualified lead is someone who reasonably fits what you offer. A freelance web designer might get 20 enquiries in a week, but only eight have a realistic budget and a project she can take on. Those eight are the number to plan around.
To work out your lead conversion rate, divide leads by website visitors and multiply by 100. If 500 visitors produce 15 enquiries, that’s 3%.
The result is only as clean as your inputs. Both counts should cover the same period, and if your analytics tool counts sessions while your lead system counts unique people, treat the percentage as an estimate.
If traffic rises but qualified leads stay flat, look at which pages and channels the new visitors came through. Either the audience is off or your offer isn’t clear enough.
3. Sales and revenue from marketing
Traffic and leads show interest. Sales show whether the interest turned into money.
Each week, record the number of completed sales, total revenue, and which channels they came from, as far as your tracking can tell you. Service businesses can add the value of signed contracts. Subscription businesses should watch new subscriptions and cancellations, since those matter more than one-off sales.
Take a small online shop with 800 visits, 24 orders, and $1,200 in revenue. That’s a clear snapshot, but $1,200 isn’t profit. Product costs, shipping, payment fees, refunds, and ad spend all come out of it.
Attribution is also messier than it looks. Someone might read a blog post, come back through an email a week later, then search your brand name and buy. Which channel gets the credit depends on how you set up attribution.
Compare each week with the last, dig into any big swings, and check that your best-selling channels make financial sense once costs are counted.
4. Conversion rate

Conversion rate is the share of visitors who complete the action you want. That might be buying, booking, filling in a form, joining a mailing list, or clicking an affiliate link.
For a store, divide orders by sessions and multiply by 100. The shop above had 24 orders from 800 sessions, so its conversion rate is 3%.
If traffic goes up and the rate drops, don’t assume the extra traffic is a win. Common culprits include product pages that leave obvious questions unanswered, shipping costs that only appear at checkout, a clumsy checkout, slow mobile pages, and ads that promise something the landing page doesn’t deliver.
Context matters here. A page built to collect enquiries shouldn’t be judged on purchases, and a blog post meant to draw search traffic has a different job from a product page. Give each important page one main goal. In Google Analytics you can mark your key actions as key events and see how they vary by traffic source.
5. Customer acquisition cost
Customer acquisition cost (CAC) is what you spend to win one new customer: total acquisition costs divided by new customers. If you spend $600 in a week and gain 20 customers, your basic CAC is $30.
The number only means something if you decide what counts as a cost and stick to it. Counting ad spend but leaving out agency fees, sales salaries, or software gives you a narrower figure than a fully loaded CAC. Be consistent about how you count customers too.
Timing can also throw it off. A campaign might generate leads this week that don’t buy until a month from now, so dividing one week’s spend by that same week’s new customers can mislead you.
CAC matters because it shows whether growth pays for itself. $30 per customer can work for a product with healthy margins and repeat buyers. It would sink a cheap item with thin margins.
If you only land a few customers a week, the weekly figure will bounce around. Review it monthly or quarterly instead.
6. Ad spend and cost per conversion
If you run Google Ads, Meta ads, or anything similar, look at spend next to results. Each week, check:
- Total spend
- Clicks and cost per click
- Leads or purchases credited to the campaigns
- Cost per conversion
- Revenue credited to ads, if your tracking supports it
Cost per conversion is spend divided by the conversions the platform counts, based on your settings. A campaign that spends $240 and records 12 leads has a cost per lead of $20.
That doesn’t mean each lead is worth $20, and it doesn’t show the campaign pays off. You still need to know how many of those leads become customers and how much profit those customers bring.
If spend goes up and qualified leads or sales don’t, check your search terms, audience targeting, landing pages, and conversion tracking before you raise the budget. And don’t make big calls off a few clicks or a handful of conversions. Small numbers swing wildly, and some campaigns take weeks to show results.
7. Email performance
Email lets you reach people without depending on social media algorithms or paying for every click. If you send marketing emails, track:
- Emails delivered
- Click rate
- Clicks to key pages or offers
- Unsubscribe rate
- Conversions or revenue linked to each campaign
Open rates give some context, but they’re unreliable. Privacy features in email apps and automated scanners can inflate or distort them, and Mailchimp’s own guidance on open and click rates says as much. Clicks and completed actions are better evidence that people are moving toward buying.
Low clicks on a delivered email point to the content, the offer, the audience, or the call to action. If clicks rise but purchases don’t, look at the page people land on, the pricing, the checkout, or whether the email attracted the wrong crowd. A jump in unsubscribes after a send usually means the message didn’t match what people signed up for, or you’re emailing too often.
8. Search performance (SEO and content)
If Google Search brings you customers, a weekly look at Search Console shows whether your content is getting seen and whether the right people are clicking. Check:
- Impressions
- Organic clicks
- Click-through rate (CTR)
- The queries that bring people to your site
- How individual pages are doing
Google defines CTR as clicks divided by impressions. Average position is there too, but it’s an average across all the times your page appeared, not a guaranteed rank for any one search.
Suppose a blog post gets 2,000 impressions this week against 1,400 last week, and clicks barely move. The page is probably showing up for more queries without winning more visits. Look at the actual queries, the title, the description, and what the searcher wanted before you change anything.
If impressions and clicks both climb, good, but that still doesn’t prove the content earns money. See whether those visitors read other pages, join your list, send an enquiry, or buy.
SEO also needs patience. Weekly numbers help you spot movement, but most content decisions need several weeks or months of data. Compare similar periods, and allow for seasonality, new posts, and shifts in search demand.
9. Retention and repeat purchases
Winning a customer is only half the job if people can buy from you again, renew, or stay subscribed. Track whichever of these fits your model:
- Repeat purchases
- Returning customers
- Subscription renewals
- Cancellations
- Revenue from existing customers
A small online store might notice that people who buy one product often come back for a related one. That’s a reason to send a follow-up email, add a recommendation, or sell the two as a bundle.
Watch the timing, though. If your customers usually buy every three or four months, a weekly repeat-purchase rate will look terrible for no good reason. Use a window that matches how people actually buy.
One easy split is new-customer revenue versus existing-customer revenue. It shows whether growth depends on finding new buyers every week or whether loyal customers are carrying part of the load.
10. Which numbers to track first
You don’t need all of these at once. Start with the ones tied most closely to your main goal.
| Business type | Priority weekly metrics |
| Local service business | Qualified leads, booked appointments, sales, lead source |
| Ecommerce store | Sessions, orders, conversion rate, revenue, CAC |
| Blog or affiliate site | Search clicks, key page traffic, affiliate clicks, commissions |
| Email-driven business | Delivered emails, clicks, conversions, unsubscribes |
| Paid advertising business | Spend, cost per conversion, qualified leads, sales |
| Subscription business | New subscribers, renewals, cancellations, recurring revenue |
Pick five to seven core metrics. Add another only when it helps you explain a problem or make a specific decision. The goal is a weekly review you’ll actually do.
11. A simple weekly review

Put your chosen numbers in one spreadsheet or dashboard, and use the same reporting period every week so the comparisons hold up.
Example scorecard (the figures are made up, so swap in your own):
| Metric | This week | Last week |
| Website sessions | 800 | 720 |
| Qualified leads | 15 | 12 |
| New customers | 8 | 6 |
| Revenue | $1,200 | $900 |
| Marketing spend | $240 | $200 |
| Conversion rate | 3% | 2.5% |
These aren’t industry benchmarks, and the conversion rate assumes you define it the same way both weeks.
Then work through it:
- Collect the numbers from your analytics, ad platforms, email service, and sales records.
- Compare like with like. Set the last seven days against the seven before, and think about holidays, promotions, and normal seasonal swings.
- Find the biggest change. One or two metrics that moved a lot are enough to investigate.
- Look for the cause. Check traffic sources, campaigns, landing pages, sales records, and tracking settings.
- Pick one action. Fix a weak landing page, test a clearer call to action, tighten ad targeting, or update a page that draws the right search traffic.
- Check the result next week, and write down what you changed.
If you want to know what caused a result, don’t change several big things at once. Change one element, then give it enough time or data to show an effect.
Common mistakes
Chasing vanity metrics. Likes, followers, impressions, and page views show visibility, not customers or profit. They’re worth a look when they help explain a business result. Otherwise put your attention on leads, sales, retention, and costs.
Missing tracking errors. A sudden drop in conversions can come from a broken form, a missing analytics event, or a checkout bug, not a real loss of interest. Every so often, submit your own form, run a test purchase where that makes sense, and confirm the action shows up in your reports.
Comparing numbers that don’t match. Tools count users, sessions, clicks, and conversions differently, and attribution settings and time zones add more gaps. Choose one main source for each metric, write down its definition, and stick with it.
Overreacting to one bad week. With small volumes, one sale can swing your weekly conversion rate, and a seasonal dip can drag every channel down at once. Treat a weekly figure as a reason to look closer, not an order to change course. For low-volume businesses, or any decision involving serious money, use a longer window.
FAQ
How many marketing metrics should a small business track weekly?
Five to seven, tied to your main goal. A service business might follow qualified leads, appointments, sales, lead sources, and acquisition cost. An online store might follow traffic, orders, conversion rate, revenue, and ad costs. Add more only when they help with a specific decision.
What’s the most important marketing metric?
It depends on the business. A company chasing new clients might care most about qualified leads. An established online store might care more about profitable sales and acquisition cost. Choose the one closest to your current goal, then track the numbers that explain it.
Should I check analytics daily or weekly?
Weekly works for many small businesses because you catch real changes without reacting to every wobble. Daily checks make sense for high-spend ad campaigns, short promotions, or when you suspect a technical problem. If your volume is low, monthly comparisons may be the only reliable ones.
What free tools can I use?
- Google Analytics for site activity and key actions
- Google Search Console for organic search performance
- The built-in reports in your email platform for delivery, clicks, and unsubscribes
- A spreadsheet to pull sales, spend, and leads together
You don’t need a pricey analytics platform to start, but set up your tracking properly before you trust what it tells you.
How do I know if my marketing is profitable?
Compare the revenue and gross profit that marketing brought in against what it cost to get that business. Include refunds, repeat purchases, and the delay between spending and selling. A good return on ad spend doesn’t automatically mean the business is profitable, since ads are only one of its costs.
Summary
The best numbers are the ones that help you decide something. Start with traffic sources, leads, sales, conversion rate, acquisition cost, and whatever is specific to your main channel. Review them the same way each week, dig into the big changes, and pick a small number of things to act on.
Over time you’ll see where customers come from, which efforts deserve more of your time, and where money is going to waste. You don’t have to measure everything. You just need a clear picture of how marketing feeds your goals.